How does the economic machine work? According to Ray Dalio, founder of the hedge fund Bridgewater Associates, the economy is the sum of countless transactions, and three main forces drive it: productivity growth over the long run, a short-term debt cycle that lasts about 5 to 8 years, and a long-term debt cycle that lasts about 75 to 100 years. Lay those three lines on top of each other and you get a rough picture of where the economy is now and where it might head next.
The idea comes from a 30-minute animated video Dalio released in 2013, How the Economic Machine Works (CNBC covered the launch). You can watch it on YouTube or on the official site. In the video, Dalio says his model differs from conventional economics, yet it has worked well for him for over 30 years and helped him see the 2008 global financial crisis coming. This guide follows the video’s order and uses small examples along the way. Unless noted otherwise, every number comes from the video.
Start with one purchase: your spending is someone else’s income
“The economy” sounds huge, but break it down and it’s just transactions. In each one, a buyer hands over money or credit and gets goods, services, or financial assets (like stocks) from a seller.
- Money: cash and bank deposits. Pay with it, and the deal is settled on the spot.
- Credit: getting something now and paying later, like using a credit card, running a tab, or taking out a loan. At the checkout, it spends just like money.
Add up all the money and credit spent in a market, and you get total spending. Divide total spending by the quantity sold, and you get the price:
Price = total spending ÷ quantity sold
A market is all the buyers and sellers trading the same thing: the wheat market, the car market, the stock market. Add up the transactions across thousands of markets, and that’s the economy. Individuals, businesses, banks, and governments trade this way every day.
The government is the biggest buyer and seller, and Dalio splits it into two parts:
- The central government: collects taxes and spends money.
- The central bank: controls how much money and credit flow through the economy. It does this by setting interest rates and by issuing new money (often called printing money).
One idea runs through the whole model: every dollar you spend is a dollar someone else earns. The more you spend, the more others earn. When everyone spends less, everyone earns less.
What is credit? Two people agree, and new spending power appears
Dalio calls credit the most important part of the economy, and probably the least understood. It’s the most important because it’s the biggest and most volatile part.
Each side of a loan wants something. Lenders want their money to make more money. Borrowers want to buy something they can’t afford yet, like a house or a car, or to start a business. Three terms first:
- Principal: the amount you borrow.
- Interest: the extra you pay on top of the principal.
- Interest rate: interest as a share of the principal. When rates are high, borrowing is expensive, so people borrow less. When rates are low, borrowing is cheap, so people borrow more.
As long as the borrower promises to repay and the lender believes that promise, credit is created. Any two people who strike that deal can create credit out of thin air.
Here’s the example from the video. You buy a beer at a bar with cash, and the deal is done the moment you pay. Now say you ask the bartender to put it on your tab. Together, the two of you just created two things:
- An asset for the bar: the money you owe, which it can collect later.
- A liability for you: the money you’ll have to pay later.
So the moment credit is created, it also becomes debt. Only when you pay the tab do the asset and the liability disappear together, and only then is the transaction truly finished.
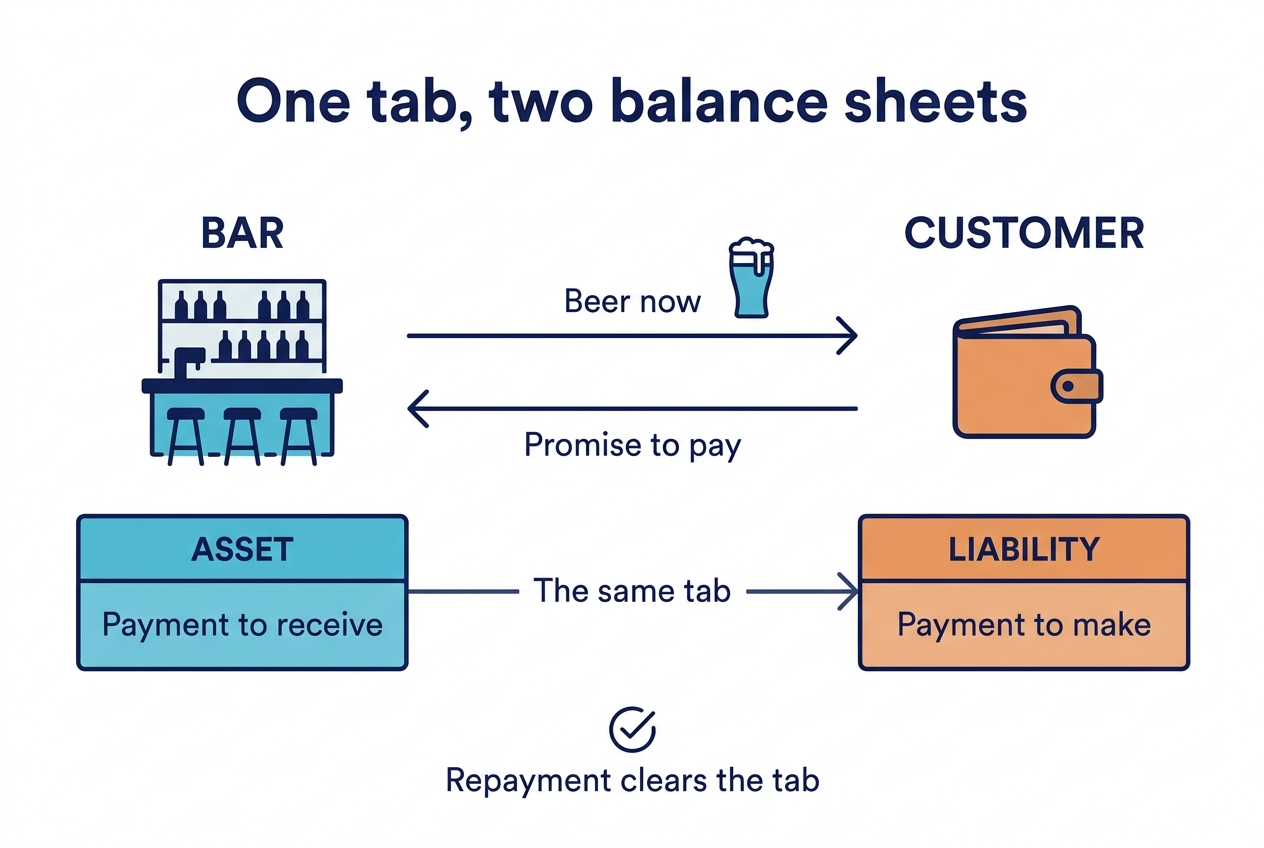
A bar tab creates an asset for the bar and a liability for the customer. Repayment settles the tab.
Why does credit matter so much? A borrower can spend more, and that extra spending becomes someone else’s income. When that person’s income rises, so does their creditworthiness, and lenders become more willing to lend to them. Dalio says a creditworthy borrower has two things:
- The ability to repay: enough income relative to their debt.
- Collateral: something valuable they can sell to pay off the debt if they fall short.
So rising income leads to more borrowing, more borrowing leads to more spending, and that spending becomes someone else’s income. The loop feeds itself. It drives growth, and it also sets up the cycles.
In practice, most of what we call “money” is actually credit. The figures in the video: total credit in the US was about $50 trillion, while the total amount of money was only about $3 trillion. Those numbers date from when the video was made, so check current data for today’s picture.
Dalio also points out that credit causes cycles, though whether it helps or hurts depends on how you use it.
- Bad credit: borrowing that lets you spend beyond your ability to repay. Say you borrow to buy a big-screen TV. The TV won’t earn you anything to pay the loan back.
- Good credit: borrowing that’s put to productive use and brings in the income to repay it. Say you borrow to buy a tractor. You harvest more crops, earn more money, pay off the debt, and end up better off.
In the long run productivity counts, in the short run borrowing does
In any transaction, you have to give something to get something. Over time, how much you get depends on how much you produce.
As people learn and build on what they know, living standards rise. That’s productivity growth. Productivity simply means how much you can produce with the same time and effort. People who innovate and work harder see their productivity and living standards rise faster, though the difference may not show up in the short run.
Picture a world with no credit. The only way to spend more would be to earn more, which means being more productive or working more. Productivity would be the only path to growth. Add up all the transactions, and you’d see a line rising slowly over time.
Credit changes that. Borrowing is spending ahead of your income: to buy something you can’t afford now, you spend more than you earn, so you borrow. In effect, you’re borrowing from your future self. When the payments come due, you have to spend less than you earn to pay the debt back. So borrowing comes with a built-in cycle from day one: spend more now, spend less later. That holds for one person and for the whole economy. Spending more today costs you spending power later, a trade-off you can think through with opportunity cost.
The video shows how this ripples outward:
| Who | Annual income | Borrowed | Can spend |
|---|---|---|---|
| You | $100,000 | $10,000 (say, on a credit card) | $110,000 |
| The person who earns your $110,000 | $110,000 | $11,000 | $121,000 |
| The next person (our extrapolation) | $121,000 | $12,100 | $133,100 |
The first two rows come from the video. The third row is our own calculation, assuming each person borrows 10% of their income. Everyone spends more than they earn, and their spending becomes the next person’s income, so in the short run spending and income across the economy grow faster than productivity. That can’t last forever. Borrowed money has to be paid back.
Dalio’s conclusion: productivity matters most in the long run, and credit matters most in the short run. Productivity changes slowly and rarely causes big swings. The economy’s ups and downs come mainly from changes in the amount of credit.
Debt rises and falls in two cycles: a short-term debt cycle of about 5 to 8 years and a long-term debt cycle of about 75 to 100 years. Most people live through them day by day and week by week, so they’re too close to see the pattern.
The short-term debt cycle: the central bank works the gas and the brake
Here’s how one short-term debt cycle plays out:
- Expansion: credit is easy to get, people spend more, and the economy picks up.
- Inflation: spending grows faster than the production of goods, so prices rise. A general rise in prices is called inflation. Because credit can be created instantly out of thin air, spending can climb quickly.
- The central bank raises rates: it doesn’t want inflation to run too high, so it raises interest rates. Fewer people can afford to borrow, and existing debts get more expensive, like your monthly credit card payment going up.
- Recession: with bigger payments and less new borrowing, people have less to spend. One person spends less, so another earns less, and prices start to fall. Falling prices are called deflation. Economic activity drops, and you get a recession.
- The central bank cuts rates: once the recession gets bad enough and inflation is no longer a worry, the central bank lowers rates. Debt payments shrink, borrowing and spending pick up, and the next expansion begins.
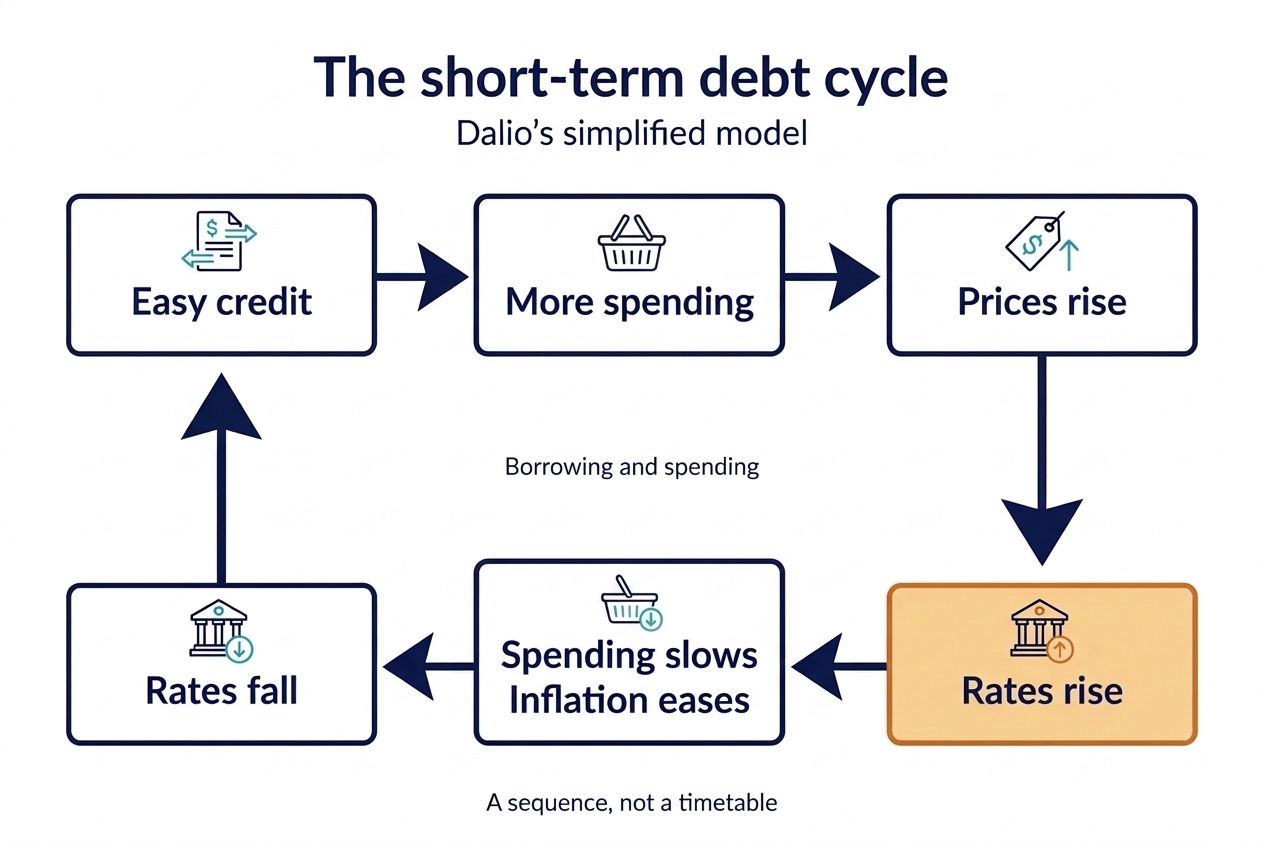
Follow the arrows through Dalio’s simplified short-term debt cycle: easier credit, more spending, rising prices, rate hikes, a slowdown, and rate cuts as inflation eases.
In the short-term cycle, the only thing limiting spending is how willing lenders are to lend and borrowers are to borrow. When credit is easy, the economy expands. When it’s tight, the economy slows down. That’s why the central bank mostly controls this cycle, and interest rates are its main tool.
There’s a catch, though. Each cycle ends with more growth and more debt than the one before, at both the peak and the bottom. Dalio puts this down to human nature: people like borrowing and spending more than they like paying debts back. Over time, debt grows faster than income, and that creates the longer cycle.
The long-term debt cycle: debt piles up for decades until it peaks
In the first half of the long-term cycle, debt keeps rising while lenders get even more relaxed. That’s because things look great, and people focus on what’s happened recently: incomes keep rising, asset prices keep rising, the stock market is booming, and borrowing to buy goods and assets looks like a smart move. When everyone borrows and spends too much, a bubble forms.
The key idea here is the debt burden:
Debt burden = debt ÷ income
As long as income grows along with debt, the debt burden stays manageable. Meanwhile, asset prices soar, people borrow more to buy assets, prices climb further, everyone feels wealthy, and borrowers still look creditworthy.
This can’t go on forever. Over decades, the debt burden slowly grows, and debt payments (the principal and interest due each period) keep rising. At some point, debt payments grow faster than income, and people have to cut spending. One person spends less, so another earns less, their credit gets worse, they borrow less, and spending drops again. The cycle reverses, and the long-term debt cycle has peaked.
Dalio’s examples: the US, Europe, and much of the world hit this peak in 2008. Japan reached it in 1989 and the US in 1929, for the same reason.
Deleveraging: a slump that rate cuts can’t fix
Leverage means using borrowed money to increase how much you can spend or invest. Piling up debt is called leveraging up. The reverse, being forced to cut debt, is called deleveraging.
During a deleveraging, a chain of things happens: people cut spending, incomes fall, credit disappears, asset prices drop, banks face runs (lots of depositors trying to pull their money out at once), the stock market crashes, and social tensions rise.
Borrowers’ incomes are falling while what they owe keeps growing, and they can’t borrow new money to pay off old debts. So they sell assets. With everyone selling at once, markets are flooded with things for sale, the stock market crashes, real estate tanks, and banks get into trouble. As asset prices fall, the collateral borrowers can put up is worth less, so their credit gets even worse. People feel poorer, and spending, income, wealth, and credit all fall together in a vicious circle.
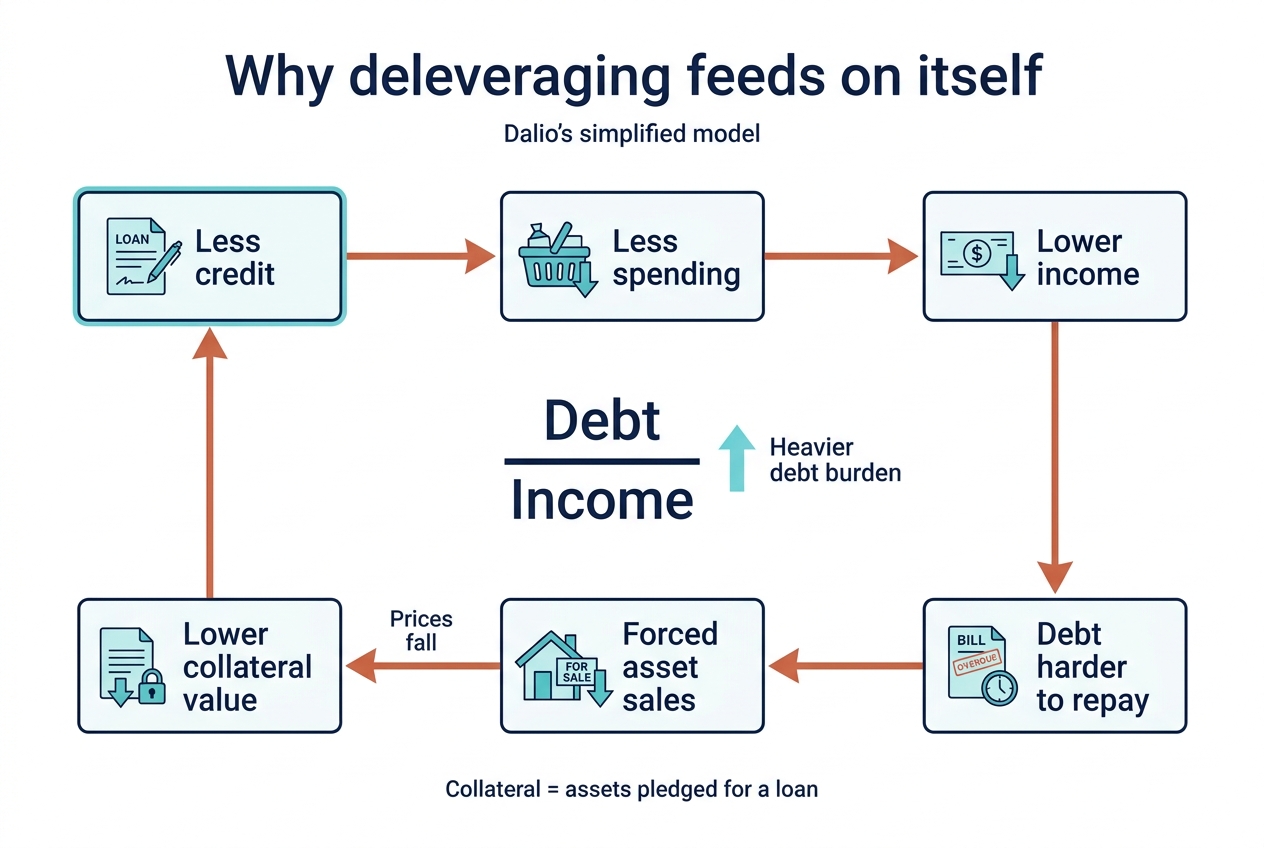
In Dalio’s simplified deleveraging loop, falling income makes debt harder to repay. Forced asset sales lower collateral values, restricting credit and spending further. The debt-to-income ratio can rise even without new borrowing.
It looks like an ordinary recession. The difference is that cutting interest rates doesn’t work:
| Comparison | Ordinary recession | Deleveraging |
|---|---|---|
| How it starts | The central bank raises rates and borrowing slows | Debt burdens get too heavy, and income and credit shrink together |
| Do rate cuts help? | Yes, lower rates encourage borrowing | Rates are near zero, so cutting further does little |
| Lenders and borrowers | Willing to lend and borrow when conditions are right | Lenders are afraid to lend, and borrowers don’t want to borrow |
| How often | About every 5 to 8 years | After the long-term debt cycle peaks |
In the US, interest rates hit zero during the deleveraging of the 1930s, and again in 2008. In December 2008, the Federal Reserve set its target for the federal funds rate at 0 to 0.25% (see the Fed’s announcement).
At that point, borrowers’ debts are so heavy that lower rates can’t ease them. Lenders realize the debts can’t be fully repaid. Borrowers have lost the ability to repay, their collateral has lost value, and they don’t want new debt. Lenders stop lending, borrowers stop borrowing, and the economy as a whole loses its creditworthiness, the same way a single person can.
Four ways to cut debt burdens, each with side effects
The trouble is that debt burdens are too heavy, so they have to come down. Dalio says every deleveraging in modern history has used these four approaches:
| Approach | What it means | Side effects |
|---|---|---|
| 1. Cut spending | People, businesses, banks, and governments tighten their belts. This is often called austerity. | Less spending means less income for others. Income falls faster than debt, so the debt burden gets heavier. Companies lay people off and unemployment rises. |
| 2. Defaults and restructurings | Borrowers can’t pay, or lenders agree to accept less, get paid later, or charge a lower rate | Lenders’ assets vanish. Depositors worry about their banks, which can trigger bank runs. |
| 3. Redistribute wealth | The government taxes the rich more to help those in need | Resentment grows between rich and poor. A long depression can lead to social unrest or even political upheaval. |
| 4. Print money | The central bank creates money to buy financial assets and government bonds | It pushes up inflation. Printing too much can cause hyperinflation. |
The first three are deflationary, so they cool the economy further. Printing money is the only one that’s inflationary and gives the economy a push. A few of these are easy to get confused about, so let’s go through them.
Why does cutting spending make the burden heavier? When borrowers stop taking on new debt and start paying down old debt, you’d expect the debt burden to shrink. But less spending means less income, because one person’s spending is another person’s income. When income falls faster than debt is repaid, the debt burden actually grows.
Why does a default make wealth vanish? Go back to the bar. The tab you ran is an asset for the bar. If you never pay, that asset becomes worthless. A severe economic contraction is called a depression, and one of its main features is people discovering that much of the wealth they thought they had isn’t really there. That’s why many lenders agree to restructure: getting paid less beats losing everything.
Why do government deficits soar? As incomes fall and unemployment rises, the government collects less tax. At the same time, many people who lose their jobs have little savings and need government support, and the government launches stimulus programs to make up for the drop in economic activity. Spending more than it collects is called a budget deficit. To fund it, the government has to raise taxes or borrow. With wealth concentrated in a few hands, governments naturally raise taxes on the rich. According to Dalio, in the 1930s this situation led to Hitler’s rise to power and war in Europe, while the US sank into the Great Depression.
Why do the central bank and the government have to work together? In 2008, the Fed printed over $2 trillion, and other central banks that could do the same printed a lot too. The central bank’s money can only buy financial assets, which pushes up their prices and mainly helps people who own financial assets. The central government can buy goods and services and put money directly in people’s hands, but it can’t print money. So the two cooperate: the central bank buys government bonds, which amounts to lending money to the government. The government uses that money for unemployment benefits and stimulus programs that raise people’s incomes. Government debt goes up, and the economy’s overall debt burden can come down.
What makes a “beautiful” deleveraging? Income has to grow faster than interest
Dalio calls this a risky moment. Policymakers have to balance the four approaches so the deflationary ones (cutting spending, reducing debt, redistributing wealth) offset the inflationary one (printing money) and keep the economy and society stable. Get the balance right, and you get what he calls a “beautiful deleveraging”: the debt-to-income ratio falls, the economy keeps growing, and inflation doesn’t become a problem.
You might ask: won’t printing money cause inflation? It won’t if the new money just replaces the credit that disappeared. What matters for prices is total spending. Every dollar spent has the same effect on prices whether it’s paid with money or credit.
The central bank also has to make sure income grows faster than the interest rate on the debt. The video’s example: a country going through a deleveraging has a debt-to-income ratio of 100%, meaning its debt equals one year of national income, and the interest rate on that debt is 2%. If debt grows 2% a year from interest while income grows only about 1%, the debt burden will never come down.
Here’s our own one-year calculation based on that example (assuming debt and income both start at 100, all interest is added to the debt, and no principal is repaid):
| Scenario | Debt after one year | Income after one year | Debt burden |
|---|---|---|---|
| Income grows 1% | 102 | 101 | About 101%, heavier |
| Income grows 3% | 102 | 103 | About 99%, lighter |
So the central bank needs to print enough money to push income growth above the interest rate. Printing money is easy, though, and more popular than the alternatives, so it’s easy to overdo. For why a popular fix tends to get pushed too far, see follow the incentives. Dalio’s warning is to avoid printing so much that you end up like Germany during its deleveraging in the 1920s, with hyperinflation.
Once incomes rise, borrowers become creditworthy again, lenders start lending again, and the debt burden finally falls. People can borrow and spend more, the economy grows again, and the long-term debt cycle enters its reflation phase, when credit and prices warm back up. A badly handled deleveraging can be awful. A well-handled one eventually fixes the problem. According to Dalio, it takes about a decade or more for debt burdens to fall and economic activity to return to normal, which is where the phrase “lost decade” comes from.
Three rules of thumb you can apply to your own money
At the end of the video, Dalio leaves three rules of thumb for everyone, policymakers included:
- Don’t have debt rise faster than income, because your debt burden will eventually crush you.
- Don’t have income rise faster than productivity, because you’ll eventually become uncompetitive.
- Do all you can to raise your productivity, because in the long run, that’s what matters most.
The wording above follows the English transcript of the video.
To apply this to yourself, check two things:
- Is the share of your income going to debt payments growing or shrinking? If it keeps growing, your debt is outpacing your income.
- Is the money you borrow buying a “big-screen TV” or a “tractor”? In other words, does it help you earn more?
This is only a self-check. Whether to borrow, and how much, still depends on how steady your income is and how high the interest rate is.
Treat the model as a sketch
Dalio himself says the real economy is more complicated than this model, and the model doesn’t follow conventional economics. Its value comes from putting the short-term debt cycle, the long-term debt cycle, and productivity side by side, so you can see where things have been, where they are, and where they might go. A few things to keep in mind:
- 5 to 8 years and 75 to 100 years are rough ranges. Don’t treat them like an alarm clock.
- The US figures here come from the 2013 video. For today’s picture, look up current data.
- The model helps you make sense of news about rate hikes, rate cuts, money printing, and deficits. It won’t tell you what to buy or sell.