At MIT, managers play a board game in which four people run a beer supply chain: retailer, wholesaler, distributor, factory. Customer demand changes once, from four cases a week to eight, and then holds steady. Orders still swing wildly, the factory’s peak order runs more than double the retailer’s, and afterward most players blame the customers.
Systems thinking explains a recurring pattern through the structure that produces it: what accumulates, what flows in and out, which effects loop back, and how long each action takes to show up. It asks what arrangement makes an outcome likely before it asks who to blame.
The beer game: steady customers, wild orders
In John Sterman’s description of the Beer Distribution Game, pennies stand for cases of beer. Each inventory starts with 12 cases, and four cases a week move through the chain. Holding stock costs $0.50 per case per week, and an unfilled backlog costs $1.00. Players cannot talk to each other. Information travels only through orders and shipments, and only the retailers see what customers actually buy.
There are no breakdowns or capacity limits. Even so:
| What happens | Typical result |
|---|---|
| Team cost | About $2,000, against an optimum of about $200 |
| Orders and inventory | Large swings, with a cycle of about 20 weeks |
| Amplification | Factory peak orders more than double retail peak orders |
| Players’ guess at demand | A surge to about 20 cases a week, then a crash |
| Actual demand | 4 cases, then 8 from week five, constant after that |
Sterman’s comment on the usual explanation: “Blaming the customer for the cycle is plausible. It is psychologically safe. And it is dead wrong.”
The cause is structural. When demand rises, shipments keep arriving at the old rate for several weeks because of the delay. Retailers watch their backlog grow and order far more than demand. That empties the wholesaler, so the retailer’s beer arrives late, and the retailer orders still more, “even though the supply pipe line contains more than enough.” Each stage amplifies the signal it receives. His 1989 paper in Management Science traced the behavior to a simple ordering rule that ignores feedback and delays. Supply-chain researchers later named the pattern the bullwhip effect.
Every queue has the same parts
Most work queues have the same elements as the game:
| Element | Practical meaning | Backlog example |
|---|---|---|
| Stock | An accumulated quantity | Outstanding orders |
| Flow | A rate that changes a stock | Incoming and completed orders per period |
| Relationship | A proposed influence between variables | Capacity affects completion rate |
| Feedback | An effect returns to an earlier variable | Backlog changes capacity decisions |
| Delay | Time between action and observable effect | Training before added staff become productive |
| Boundary | What the model includes | Preparation and approval, with transit outside |
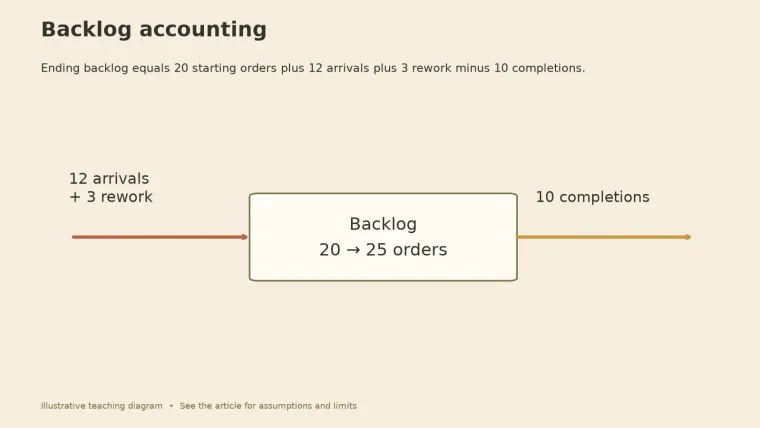
Stocks change only through flows. A simple accounting line keeps that honest:
Ending backlog = starting backlog + arrivals + rework - completions.
With 20 orders waiting, 12 new arrivals, 3 returned for rework, and 10 completed, the queue ends the day at 25. The arithmetic cannot say why rework happened, but it shows which flow to investigate first.
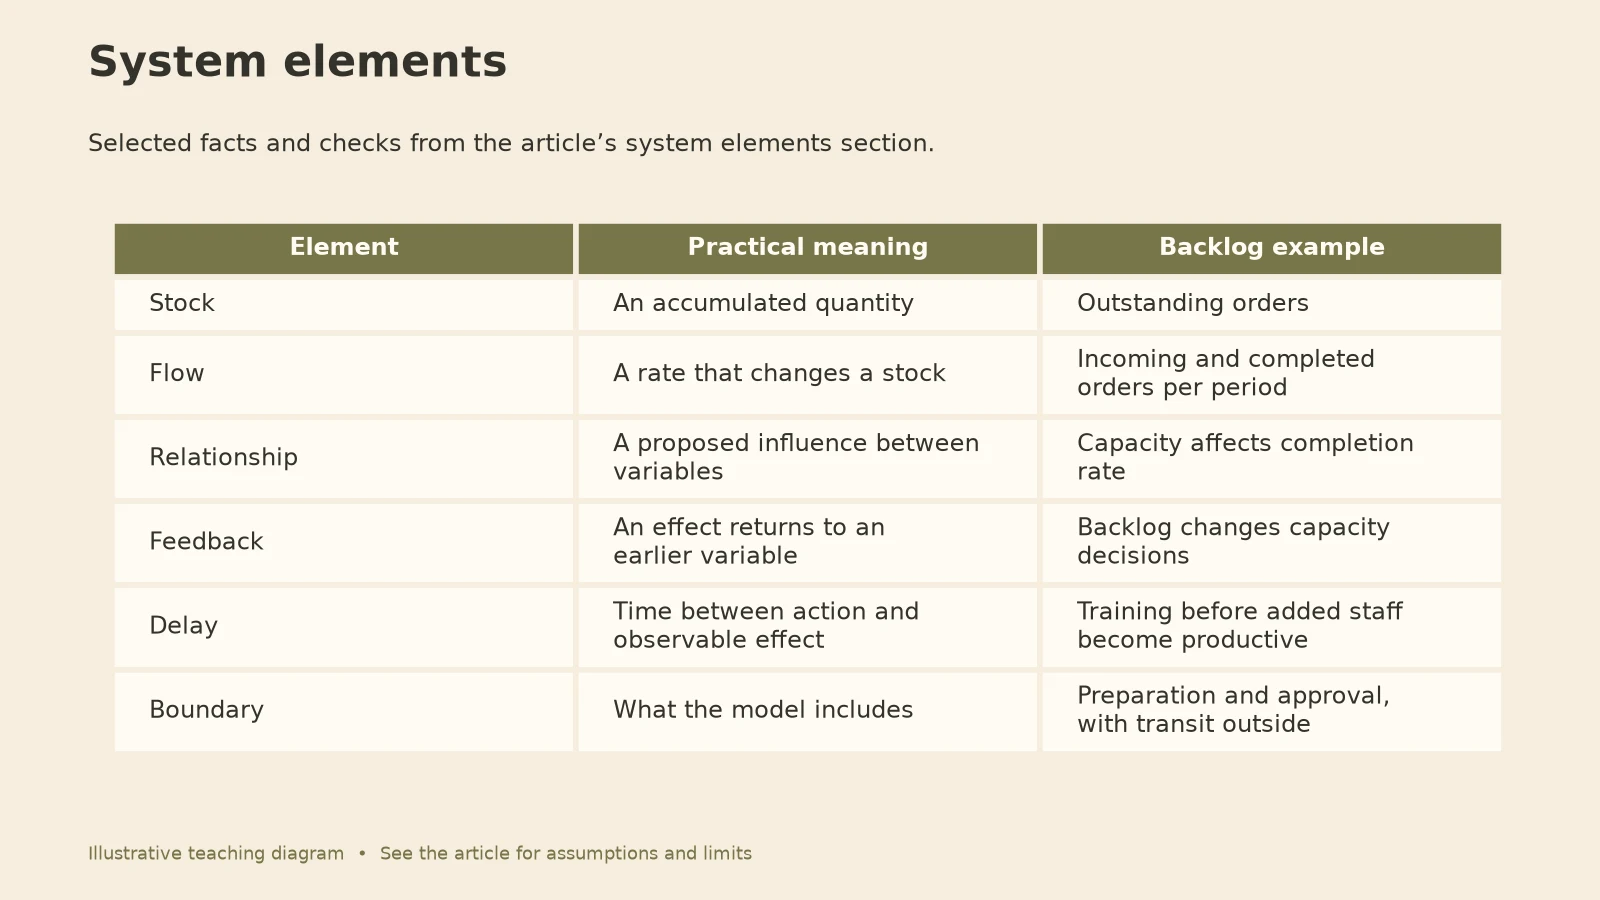
In the game, inventory and backlog are the stocks, orders and shipments are the flows, the shipping time is the delay, and each player’s boundary stops at their own sector. That last point does the most damage. Nobody can see the beer already in transit, so everyone orders as if it does not exist.
Blame is the default, and it usually misses
When a pattern repeats, the quickest story names a person or an outside shock. Systems thinking adds a second question: what would make a reasonable person in this seat do the same thing?
| Question | Event thinking | Systems thinking |
|---|---|---|
| What happened? | Demand spiked, then collapsed | Orders oscillated while demand stayed flat |
| Why? | The customer, or a careless teammate | Delays plus an ordering rule that ignores the pipeline |
| What to change? | Replace the player | Share demand data, count goods in transit |
| How to check? | See if the next quarter is calmer | Watch whether the swing shrinks under the same demand |
People still make choices and still answer for them. The structure explains why different people in the same seat keep making the same choice. Donella Meadows’ essay on places to intervene in a system ranks changing who sees what above changing numbers. In the beer game, showing every player the real demand would do more than telling them to order carefully.
For the loops themselves, see feedback loops. For a four-level way of moving from an event to the beliefs behind it, use the iceberg model.
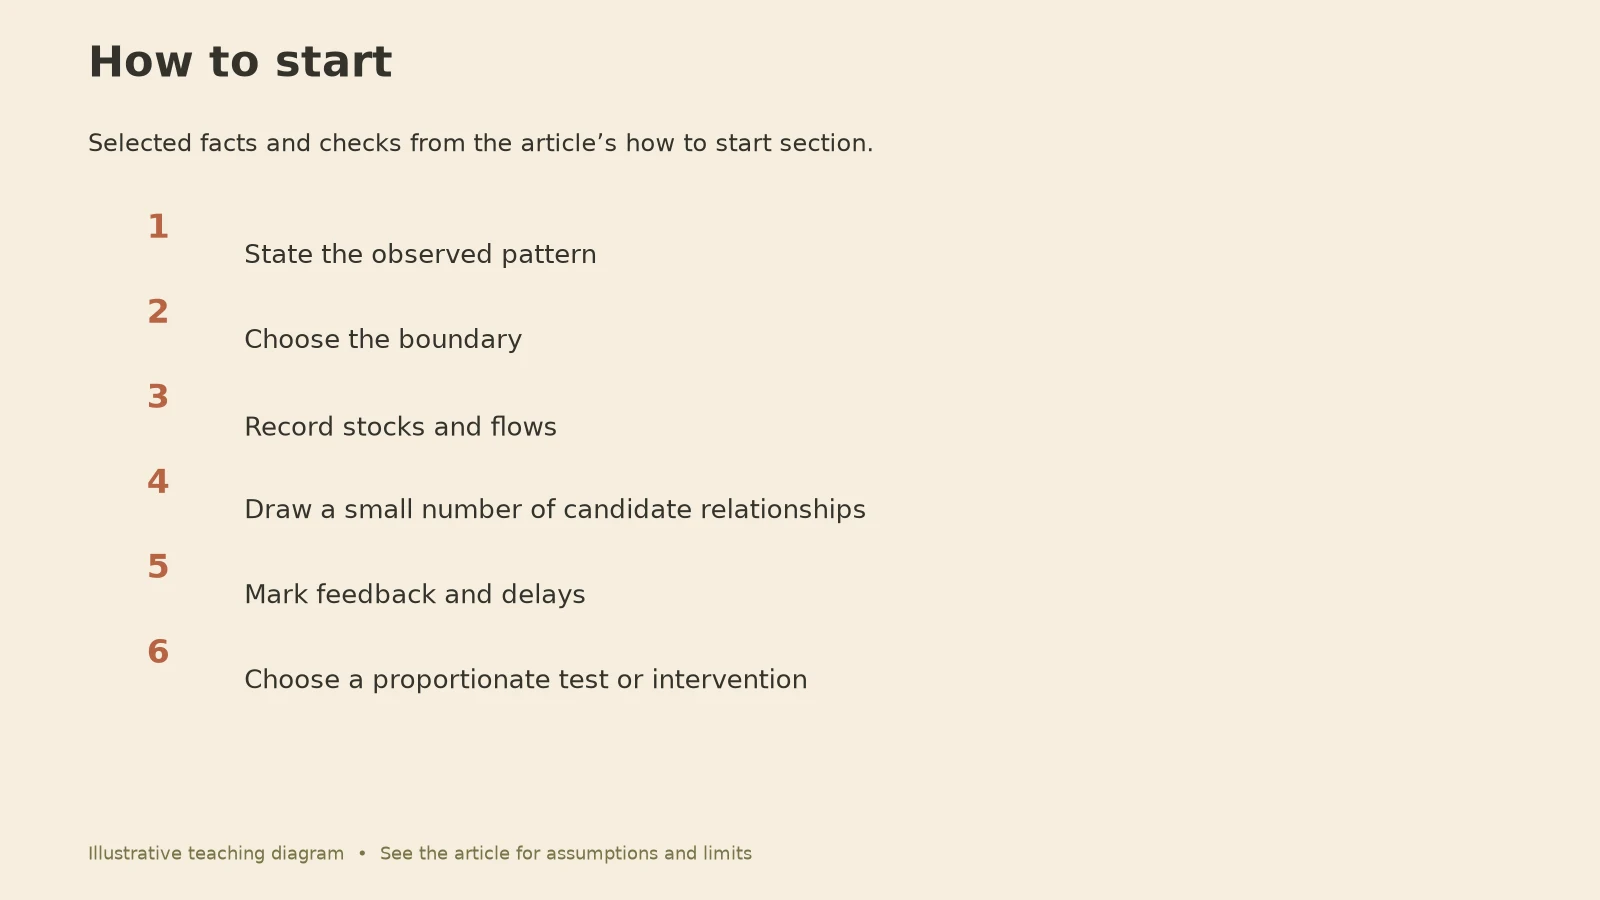
How to start a systems investigation
- State the observed pattern. Name the quantity and the period rather than a vague complaint.
- Choose the boundary. List what is included and the outside influences you are setting aside.
- Record stocks and flows. Use consistent units and definitions.
- Draw a small number of candidate relationships. Note the evidence and uncertainty for each.
- Mark feedback and delays. Trace whether each cycle amplifies or counteracts a change.
- Choose a proportionate test or intervention. Name the expected effect and possible side effects.
Afterward, check whether the problem improved or just moved, say from approval into dispatch. That ripple is the subject of second-order thinking. If the fix changes an experience for real people, systems thinking vs design thinking shows how diagnosis and prototyping fit together.
When systems thinking backfires
The diagram gets bigger than the problem. A map with forty arrows feels thorough and tests nothing. Start with the one pattern you can measure.
“It’s the system” becomes an alibi. Structure explains behavior; it does not excuse it. Name who can change the structure and ask them to act.
A neat loop is treated as proof. A causal link can be plausible and still wrong. Look for an observation that would separate your model from a simpler story, such as a change in arrivals rather than in productivity.
Questions
Is systems thinking just looking at the big picture?
It includes a wider view, plus specific stocks, flows, units, feedback, delays, and a declared boundary. “Everything is connected” is a mood. A system map should be specific enough to be wrong.
Does it remove personal responsibility?
No. People still make choices. The method looks at the arrangements shaping those choices so a fix reaches the next person in the seat, too.
How large should my first diagram be?
Small enough to explain in a minute and test in a week. Expand only when a missing element would change what you do.
Your 5-minute system sketch
Pattern that keeps repeating (quantity + period):
What accumulates here (the stock)?
What adds to it? What drains it?
Where is the longest delay between action and effect?
What can each person see? What can't they see?
One loop that might be amplifying the problem:
Smallest test that would show whether I'm right:
Pick one recurring annoyance from this week and sketch it on Daily Read before you decide whose fault it is.