
In 1817, David Ricardo published a puzzle built from four numbers. A fixed amount of cloth took the labour of 100 men for a year in England and 90 in Portugal. A fixed amount of wine took 120 men in England and only 80 in Portugal. Portugal was better at both. Ricardo still argued that Portugal should import its cloth.
The opportunity cost formula depends on the question. For a choice, opportunity cost is the value of the best feasible alternative you give up. For a trade-off between two goods, divide the units given up by the units gained. Subtracting one return from another gives a return gap, which is a different number.
Ricardo’s puzzle is one division
Ricardo never used the phrase “opportunity cost.” Modern textbooks still teach his example with it, because the per-unit formula solves the puzzle:
| Country | Labour for the cloth | Labour for the wine | Opportunity cost of the wine | Opportunity cost of the cloth |
|---|---|---|---|---|
| England | 100 men-years | 120 men-years | 120 ÷ 100 = 1.2 cloth | 100 ÷ 120 ≈ 0.83 wine |
| Portugal | 90 men-years | 80 men-years | 80 ÷ 90 ≈ 0.89 cloth | 90 ÷ 80 = 1.125 wine |
When England makes the wine, the labour it uses could have made 1.2 units of cloth. Portugal gives up only 0.89 cloth for the same wine. So wine is cheaper in Portugal and cloth is cheaper in England, measured in what each country sacrifices. Ricardo’s conclusion follows: “England would give the produce of the labour of 100 men, for the produce of the labour of 80.”
Comparing labour hours alone made Portugal look better at everything. Writing the cost in units of the other good made the right specialization obvious. The rest of this guide applies that lesson: pick the formula that answers your question, and keep the units attached.
Three formulas for three questions
| Question | Calculation | What the answer means |
|---|---|---|
| What am I giving up by choosing A? | Value of the best alternative to A | The forgone value |
| How much more return would B provide than A? | Return from B − return from A | The relative return gap |
| How much Y do I give up for each additional X? | Units of Y given up ÷ additional units of X | Opportunity cost per unit of X |
You may see OC = FO − CO, where FO is the return from the forgone option and CO is the return from the chosen option. That subtraction compares two returns. Under the next-best-alternative definition used by OpenStax, FO itself is the forgone value. Write which quantity you mean before you calculate.

Identify the best feasible alternative; do not add up every rejected choice.
Forgone value versus return gap
Take a fictional one-year comparison of net returns, after each project’s relevant costs:
| Project | Illustrative net return | Status |
|---|---|---|
| A | $600 | Chosen |
| B | $900 | Best alternative |
| C | $400 | Other alternative |
Choosing A forgoes B’s $900 net return. The return gap is $900 − $600 = $300. Adding B and C to get $1,300 would count two alternatives you could never have done together. Calling $300 the entire value forgone would mix the two questions.
Calculate it in five steps
- State the choice and resource. For example: “Which project gets our one available machine next week?”
- List the realistic alternatives. Include doing nothing if it is a real option. Remove anything that breaks the budget, deadline, or capacity.
- Choose a common comparison basis. Use the same period and consistent gross or net figures. If you use net benefits, do not subtract the same costs again.
- Find the best alternative you would give up. With mutually exclusive projects, this is one alternative. A combination counts as one alternative only if you could actually carry it out.
- Calculate and label the answer. Say “$900 forgone net return,” “$300 return gap,” or “3 units of Y per additional X.” Record assumptions beside it.
If the result depends on a forecast, rerun it with a less favorable assumption. A precise subtraction does not make an uncertain input reliable. Second-order thinking helps find consequences missing from the first comparison.
Read opportunity cost from a graph
On a production possibilities frontier, getting more of one good means giving up some of another. The ratio is the same one Ricardo’s numbers needed:
Opportunity cost of X = decrease in Y ÷ increase in X.
This is the units-given-up divided by units-gained method taught in introductory economics. Read the axis labels first, because reversing the direction changes both the numerator and the units.
Consider this fictional frontier, drawn as straight segments between the listed points:
| Point | Units of X | Units of Y |
|---|---|---|
| A | 2 | 18 |
| B | 4 | 12 |
| C | 6 | 2 |
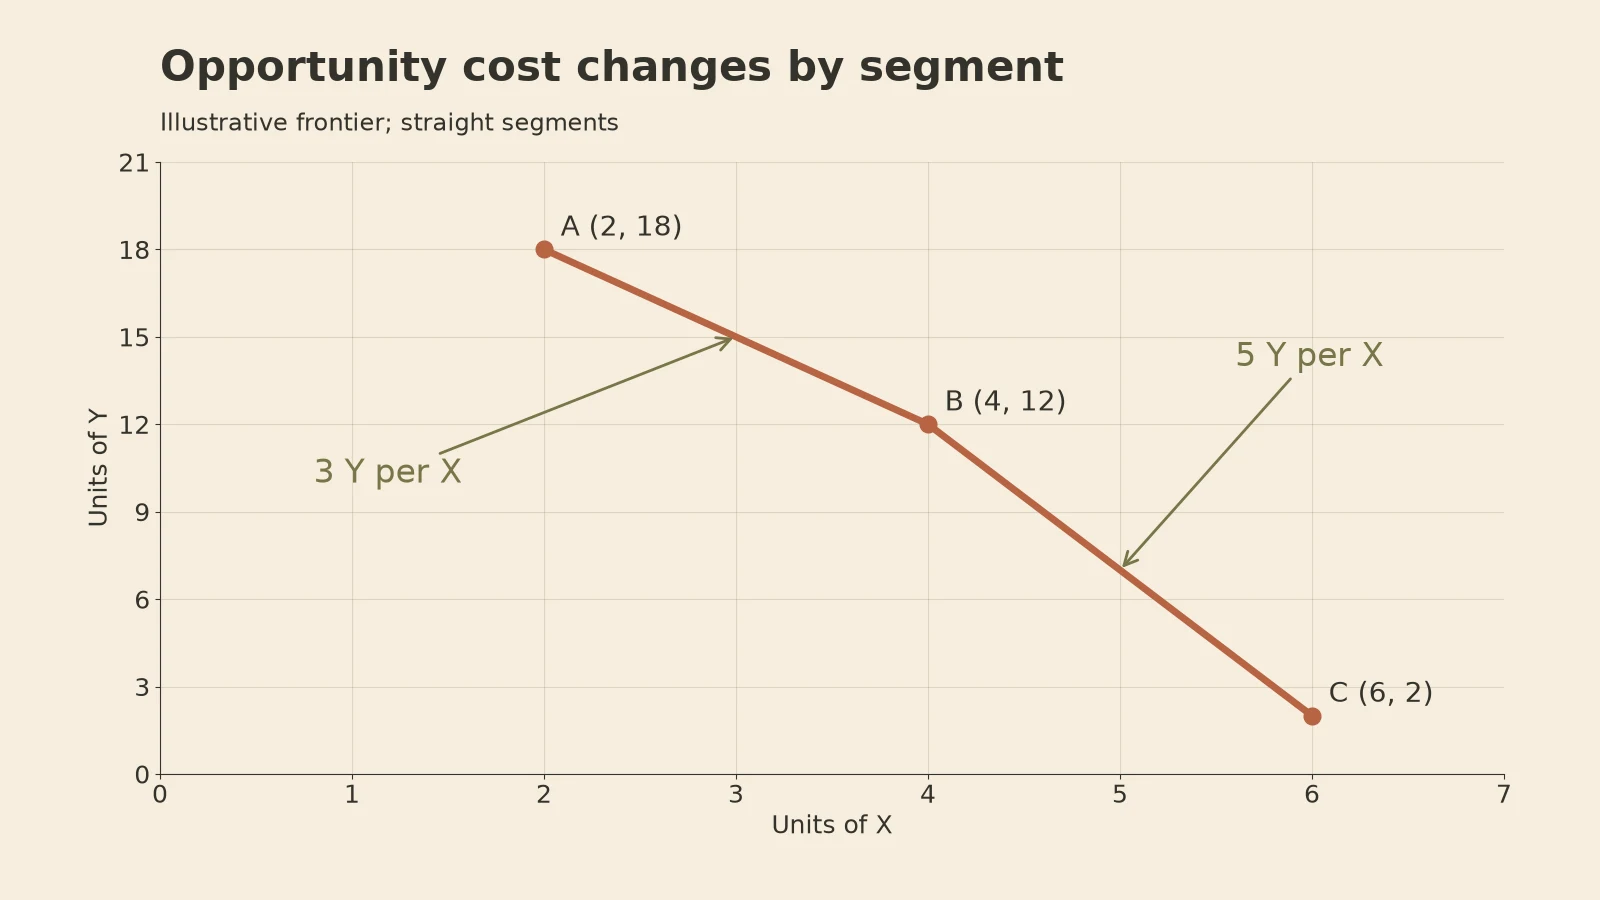
From A to B, 6 Y buys 2 extra X. From B to C, 10 Y buys the same 2 extra X.
- A → B: give up 18 − 12 = 6 Y; gain 4 − 2 = 2 X. Cost = 3 Y per X.
- B → C: give up 12 − 2 = 10 Y; gain 6 − 4 = 2 X. Cost = 5 Y per X.
- A → C: give up 16 Y; gain 4 X. The average across both segments is 4 Y per X.
The cost rises from the first segment to the second, and the 4 Y average does not mean every extra X costs exactly 4 Y. Ricardo’s countries had constant costs, which would draw a straight line. Rising costs like these are the subject of the law of increasing opportunity cost.
Going back from B to A gives up 2 X to gain 6 Y, so the reverse cost is 1/3 X per Y. That is the reciprocal in different units, and it does not contradict the first answer.
When the formula misleads
Comparing totals instead of ratios. Portugal’s lower labour counts hid the real answer. Two options can differ in total cost while the sacrifice per unit points the other way.
Adding every rejected choice. Use the single best alternative you could really have taken. An impossible bundle of everything you turned down is not a cost you faced.
Pricing every hour at your wage. An evening is worth your hourly rate only if paid work was actually available and you would have taken it.
Counting sunk costs. An unrecoverable fee is the same under every option, so it cannot separate them. See sunk cost fallacy vs opportunity cost.
Trusting the model’s assumptions. Ricardo’s example ignores transport costs, other inputs, and rising costs. A clean ratio is only as good as the conditions behind it.
A worksheet for your own trade-off
| Field | Fill in |
|---|---|
| Choice and limited resource | What can only be used once? |
| Feasible options | What could I actually do? |
| Chosen option | Which option am I evaluating? |
| Best alternative | What would I otherwise choose? |
| Comparison basis | Same period, units, and treatment of costs |
| Forgone value | Value of the best alternative |
| Optional return gap | Alternative value minus chosen value |
| Uncertain assumption | What could change the ranking? |

Keep the choice, the alternative, and the units in the same record.
For practice, choose P with a net benefit of $80 when the other options, Q and R, offer $110 and $65. The forgone value is $110; the return gap is $30. You do not add Q and R. When several criteria matter, pair the worksheet with decision-making frameworks.
Frequently asked questions
What is the formula for opportunity cost?
For a choice, find the value of the best option you could actually have taken instead. For a per-unit trade-off, divide what you give up by what you gain. Subtracting the chosen return from the alternative return gives a comparison gap, so label it that way.
How do you calculate opportunity cost with a graph?
Read two points and the axis units. Divide the reduction in the forgone good by the increase in the desired good. On a curved frontier, a ratio between two points is an average over that interval.
What is a famous example of opportunity cost?
Ricardo’s England and Portugal. England’s wine cost 1.2 units of cloth; Portugal’s cost about 0.89. That gap, not total labour, decides who should make what. For the core idea, see opportunity cost.
Your 5-minute opportunity cost check
Choice:
Limited resource (money / hours / machine time):
Best feasible alternative (one, not a bundle):
Question I'm answering: forgone value / return gap / per-unit cost
Answer, with units:
Assumption that could flip the ranking:
To check the arithmetic, paste the filled card into a prompt from Save Effort and ask it to verify the units and spot any alternative you counted twice.