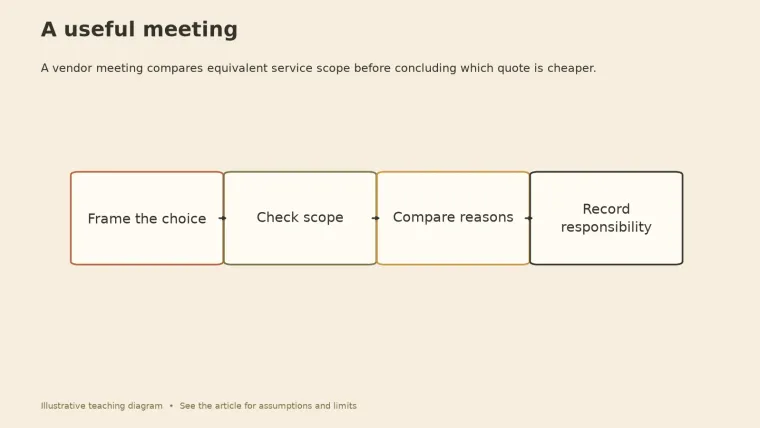
In 2010, two prominent economists published a finding that moved governments: countries with public debt above 90% of GDP had average growth of -0.1%. Politicians on both sides of the Atlantic quoted the threshold. In 2013, a graduate student assigned to reproduce the result for a class could not make the numbers match. His professor told him to go sort it out. He did.
Critical thinking in the workplace means checking the evidence, assumptions, and alternatives behind a claim before a team acts on it. In practice it comes down to a few questions: what was measured, which cases were included, compared with what, and could someone else reproduce the number?
A student, a spreadsheet, and a famous number
The paper was Carmen Reinhart and Kenneth Rogoff’s “Growth in a Time of Debt.” According to the BBC, EU commissioner Olli Rehn and US Republican Paul Ryan both cited a 90% debt limit to support austerity plans.
Thomas Herndon, a doctoral student at the University of Massachusetts Amherst, picked the paper for a replication assignment. His results kept coming out different. “Come on, Tom, this isn’t too hard - you just gotta go sort this out,” his professor, Michael Ash, told him. Reinhart and Rogoff then shared their working spreadsheet.
Herndon, Ash, and Robert Pollin’s 2013 paper found three problems:
| What they checked | In the published result | What the spreadsheet showed |
|---|---|---|
| Which countries were averaged | A coding error left out Australia, Austria, Belgium, Canada, and Denmark | Three of the five had years above 90% debt |
| Which years were included | Early postwar years for Australia, Canada, and New Zealand were excluded | Those years had high debt and decent growth |
| How the average was weighted | Each country counted equally, so one New Zealand year at -7.6% carried 1/7 of the weight | Weighting by country-years changes the picture |
| The headline number | -0.1% average growth above 90% debt | 2.2% when properly calculated |
Reinhart and Rogoff acknowledged the coding error but defended their other choices and their broader view that high debt is associated with slower growth. Even the critics’ corrected figures showed somewhat lower growth at high debt levels. What disappeared was the cliff at 90%.
The lesson for a workplace has little to do with economics. The error sat in a spreadsheet for about three years while the number traveled into policy speeches. The person who finally checked was the most junior one in the story, doing homework.
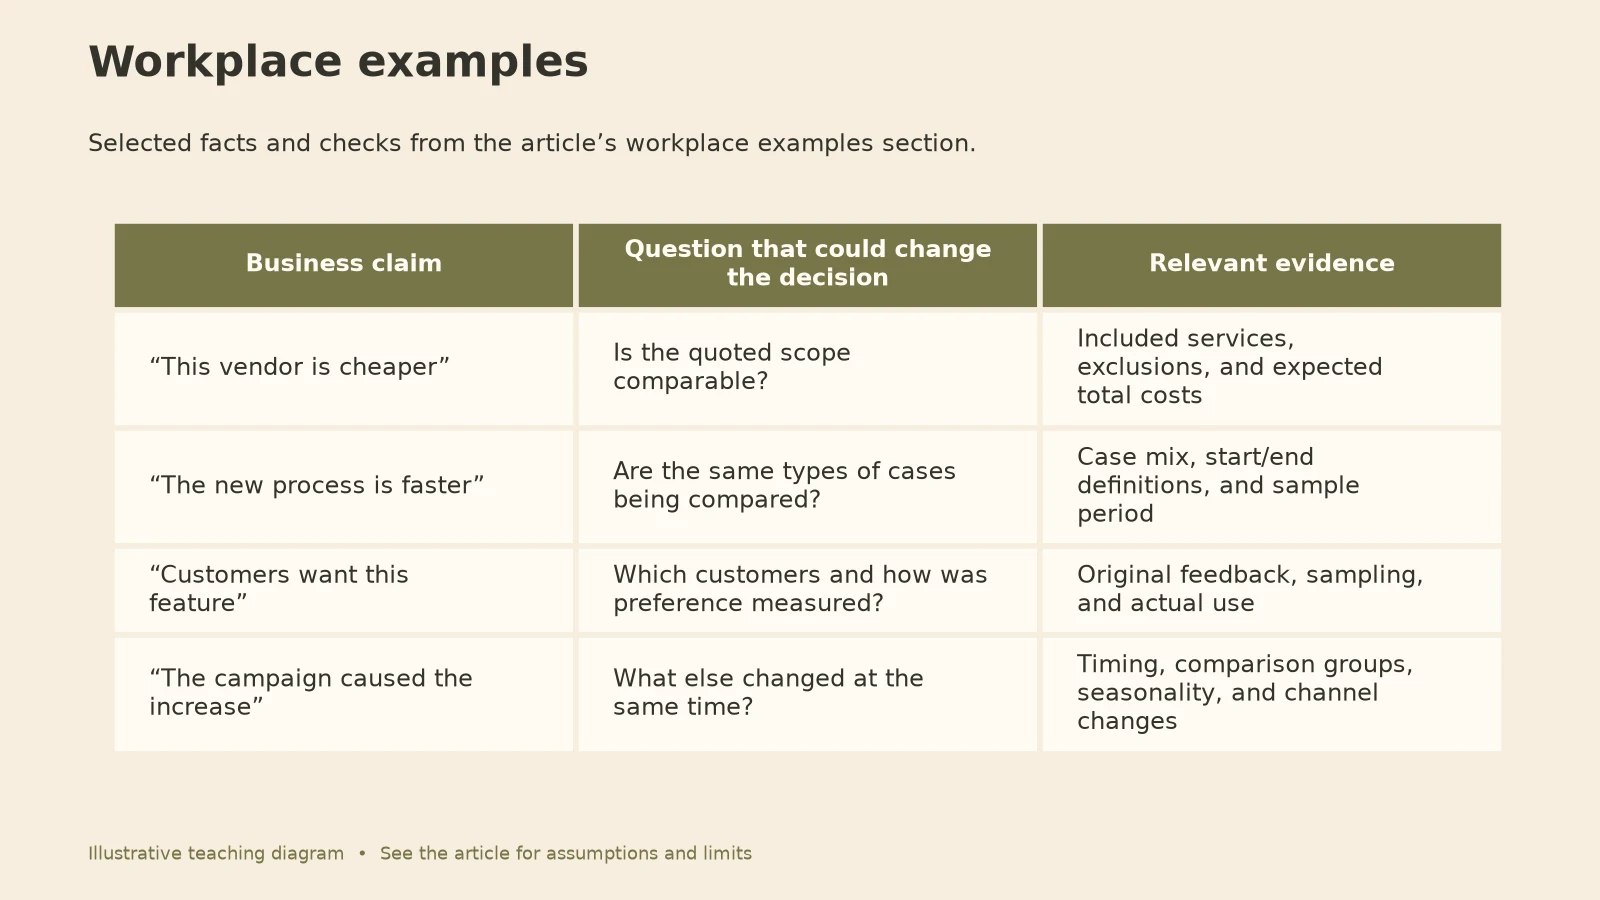
Four workplace claims and the question that changes them
Most numbers at work are smaller, and the same move applies: find the question whose answer could change the decision.
| Business claim | Question that could change the decision | Relevant evidence |
|---|---|---|
| “This vendor is cheaper” | Is the quoted scope comparable? | Included services, exclusions, and expected total costs |
| “The new process is faster” | Are the same types of cases being compared? | Case mix, start/end definitions, and sample period |
| “Customers want this feature” | Which customers and how was preference measured? | Original feedback, sampling, and actual use |
| “The campaign caused the increase” | What else changed at the same time? | Timing, comparison groups, seasonality, and channel changes |
Each row asks the Herndon question in a different form: what is inside this number? When one side holds data the other cannot easily check, the information-asymmetry guide shows who can verify what. When a metric moves under target pressure, Goodhart’s law separates the proxy from the outcome.
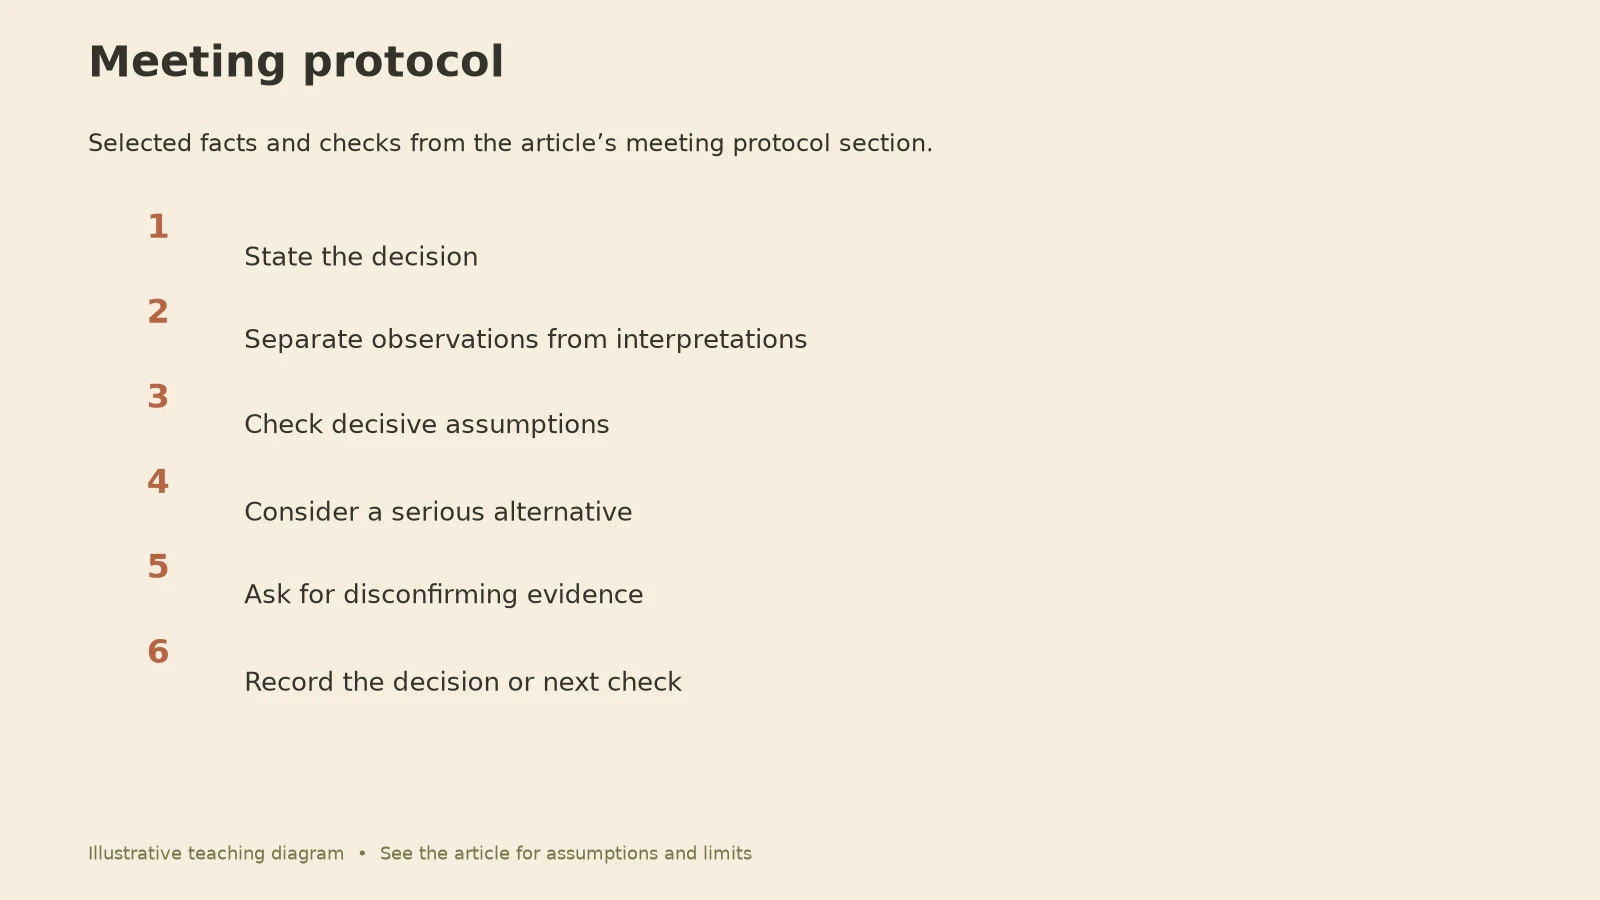
A meeting protocol for numbers that matter
- State the decision. Name the options and the person responsible for choosing.
- Separate observations from interpretations. “Average growth was -0.1% in this sample” is different from “debt above 90% stops growth.”
- Check decisive assumptions. Which rows, years, and weights does the number depend on?
- Consider a serious alternative. Include a real option and avoid a straw alternative.
- Ask for disconfirming evidence. What finding would make the preferred option less attractive? Can someone outside the team reproduce the figure?
- Record the decision or next check. Give it an owner, a date, and a link to the source data.
Step 3 is where most workplace errors hide. A dashboard filter, a missing month, or an average of averages can move a result as much as a formula range did here.
Make checking safe for junior people
Herndon had two protections most employees lack: an assignment that required checking, and authors who handed over their file. At work, the person closest to the data is often the least senior, and questioning a director’s slide can feel risky.
Make it routine instead of brave. Share source files with key figures. Ask “Can someone else rebuild this number?” before a big decision. Thank the person who finds the error, even when it hurts the plan. The workplace power-dynamics guide helps make decision rights and information routes visible. For a case where engineers had the evidence and a meeting overrode them, see decision making and the night before Challenger.
When workplace critical thinking backfires
Gotcha culture. One error does not automatically sink a whole conclusion. Reinhart and Rogoff’s broader correlation survived in weaker form. Say exactly what the error changes.
Checking only the numbers you dislike. Teams audit the forecast that threatens their project and wave through the one that supports it. The confirmation-bias guide covers that trap.
Auditing everything. Reproducing every figure stalls work. Scale the checking to the stakes and reversibility.
Judging by outcome alone. A review afterward should examine the evidence available at the time, not only whether the choice worked out.
Your 5-minute number check
Number driving the decision:
Who produced it, and from what file?
Which cases, dates, or rows are included? Which are left out?
How is it averaged or weighted?
Compared with what?
Could someone else rebuild it? Who will try?
If it were wrong by half, would we decide differently?
Before your next decision meeting, take five quiet minutes in Slow Down to fill it in for the one figure everyone is leaning on.
Questions
Does critical thinking mean being negative at work?
No. It means checking whether a conclusion follows from the evidence. A useful contribution can support a proposal, narrow a claim, or find the one missing fact needed to proceed.
How do I challenge a manager’s number constructively?
Ask about the data rather than the person: “Does this average include the returns from March?” Offer to rebuild it with them. For consequential concerns, follow your organization’s formal process and keep a written record.
How can a team keep this from slowing everything down?
Keep routine, reversible decisions short. Reserve deeper checks for the figures that could change a consequential action. For individual practice, see how to improve critical thinking.